Household Financial Resilience Index Afhri Q2 2023
21 November, 2024
Quarter 2 2023 shows squeeze on household finances, Download the index for further information.
"Christmas may also be bleak for retailers across the board, with households now very clearly under severe strain, especially those in the lower income brackets."
Background to the AFHRI
In recognition of the need for data that provides more clarity on the financial disposition of households in general, and their ability to cope with debt in particular, Altron FinTech commissioned economist and economic advisor to the Optimum Investment Group, Dr Roelof Botha, to assist in designing this index. The AFHRI comprises 20 different indicators, all related to sources of income or asset values. The AFHRI is weighted according to the demand side of the short-term lending industry and calculated on a quarterly basis, with the first quarter of 2014 being the base period, equalling an index value of 100. All of the indicators are expressed in real terms, i.e., after adjustment for inflation.
Media Release
Altron FinTech Household Resilience Index (AFHRI) Quarter 2 2023 shows squeeze on household finances
Johannesburg, 19 October 2023 – The results of the latest Altron FinTech Household Resilience Index (AFHRI) were released today, showing that higher interest rates continue to squeeze the finances of most households, with 11 of the 20 constituent indicators of the AFHRI having declined year-on-year and nine having declined since the last comparable quarter before the pandemic.
Background to the AFHRI
In recognition of the need for data that provides more clarity on the financial disposition of households in general, and their ability to cope with debt in particular, Altron FinTech commissioned economist and economic advisor to the Optimum Investment Group, Dr Roelof Botha, to assist in designing this index. The AFHRI comprises 20 different indicators, all related to sources of income or asset values. The AFHRI is weighted according to the demand side of the short-term lending industry and calculated on a quarterly basis, with the first quarter of 2014 being the base period, equalling an index value of 100. All of the indicators are expressed in real terms, i.e., after adjustment for inflation.
Johan Gellatly, MD of Altron FinTech
Johan Gellatly, MD of Altron FinTech, says these results don’t bode well for consumers to spend excessively in the run up to Black Friday, one of the key events in the annual retail calendar, even though November is typically marked by retailers offering massive discounts.
“Christmas may also be bleak for retailers across the board, with households now very clearly under severe strain, especially those in the lower income brackets. The AFHRI is invaluable in this respect, providing benchmarking information to us on key market trends so we can assist our clients to continue trading in challenging times by making sure our solutions are both effective and fit-for-purpose.”
AFHRI results for the second quarter of 2023 explained
According to economist Dr Roelof Botha, who compiles the index on behalf of Altron FinTech, ever since the onset of restrictive monetary policy in South Africa, the financial resilience of households has been under pressure, with a strong – and predictable – inverse correlation between higher interest rates and the AFHRI trend. “The gains made in the post-COVID-19 recovery period have now been wiped out by the highest interest rates in 15 years, with the current real prime overdraft rate, i.e., prime minus the consumer price index (CPI), at a level of 7%, more than double the average rate that existed during the tenure of the previous Governor of the South African Reserve Bank (SARB), Gill Marcus,” says Botha.
The SARB’s decision to raise interest rates to higher levels than before the pandemic continues to be a thorn in the flesh of most households and businesses, as this overly hawkish policy approach is not based on any signs of demand inflation in the economy. During 2022 and the beginning of 2023, the lingering effects of higher fuel prices, record increases in global freight shipping charges, and an unusually strong US dollar, were primarily responsible for higher inflation all over the world, including South Africa.
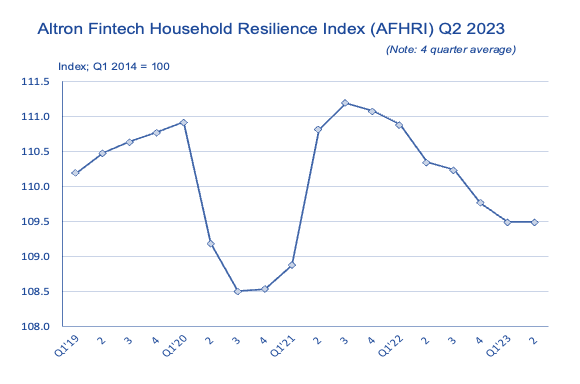
In the second quarter of 2023, the AFHRI recorded a value of 109, a marginal increase compared to the level of 108.6 during the first quarter of the year. No change was recorded year-on-year. With a base level of 100 for the inception period of the index (Q1 2014), this means that the average household’s financial disposition has improved by only 9% in real terms over a period of more than nine years.
“Since 2014, the average annual improvement in the index is less than 1%, which serves as a clear indication of the economy’s underperformance, mainly because of low investor and business confidence resulting from state capture and the erosion of the efficiency of infrastructure. Over the past 18 months, this has been exacerbated by the negative effects of a sharp increase in the cost of credit,” explains Botha.
The graph that follows illustrates the declining trend based on a four-quarter average, which eliminates seasonal variances.

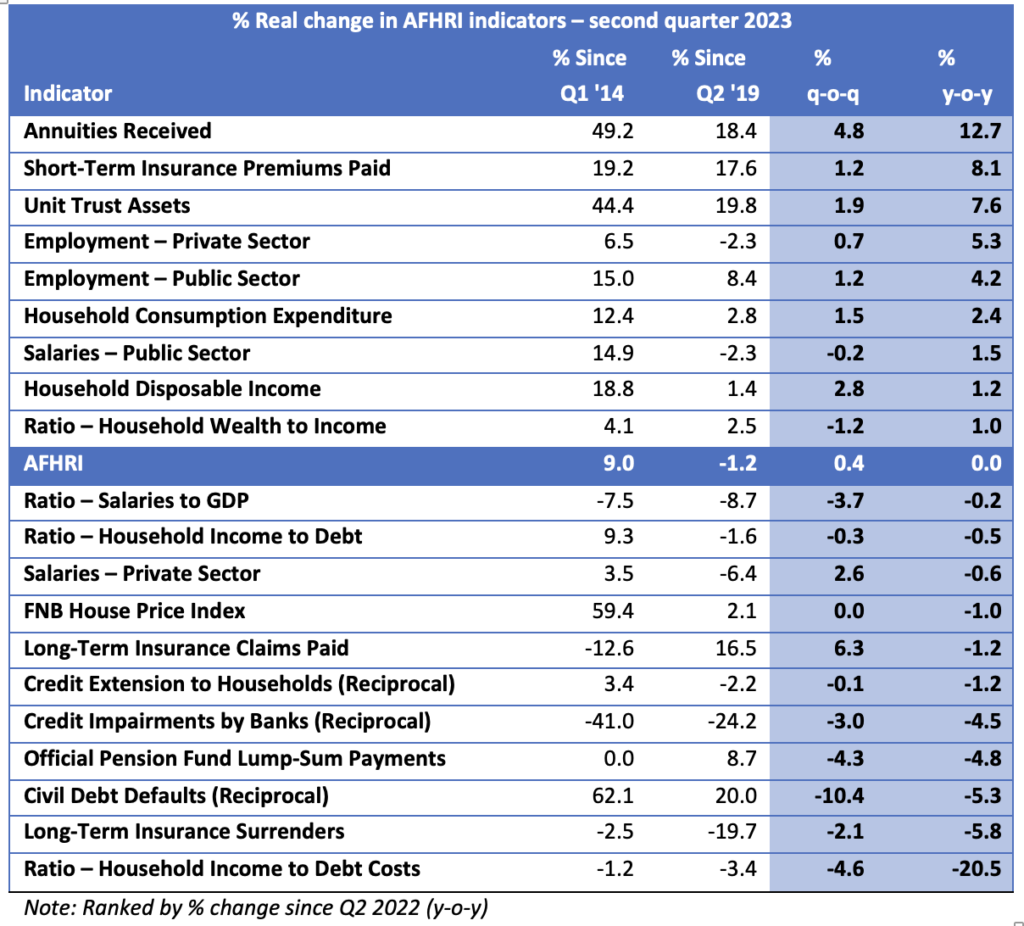
The table below summarises the performance of the different indicators comprising the AFHRI over four different periods, namely (1) since the base period (2014); (2) since the last comparable quarter before the COVID-19 lockdowns kicked in (Q2 2019); (3) quarter-on-quarter; and (4) and year-on-year (percentage changes in real terms). The period since the second quarter of 2019 is regarded as relevant to gauge whether the financial resilience of households has fully recovered from the pandemic or not.

According to Botha, scrutiny of key constituent indicators of the AFHRI and the reasons for the overall downward trend reveal the following:
- The refusal of the Monetary Policy Committee (MPC) of the SARB to adopt an accommodating monetary policy stance, even though inflation, as measured by the CPI and the producer price index (PPI) peaked more than a year ago, should cause concern at National Treasury and the South African Revenue Services, as subdued household expenditure is threatening the country’s fiscal stability. Restrictive monetary policy by the SARB since the end of 2021 has raised the cost of credit (and of capital) by 68% (measured against the prime overdraft rate).
- Despite inflation having moved to a comfortable level of close to the mid-point of the SARB’s target range of 3% to 6%, the MPC’s insistence on maintaining a real prime rate of 7% defies logic, as this rate is now 126% higher than the average real prime rate that existed in 2014.
- Against the background of lower taxation revenues than the budget estimates, consistent increases in welfare grant payments and exceedingly high unemployment, it seems quite strange that the MPC has opted for excessively restrictive monetary policy, knowing full well that the short-term interest rate is a blunt instrument that directly affects the cost of credit and of capital. Unnecessarily high interest rates have a profound negative impact on the ability of households to maintain their standard of living and on the ability of businesses to invest in new productive capacity.
- One of the most valid criticisms of the MPC’s ignorance of the plight of South African households is the fact that, in real terms, total household credit extension, which is valued at more than R2 trillion, has declined by 3.5% since 2017, which means that there has not been any growth in this key macroeconomic indicator over almost a decade.
- From an analysis of the relationship between GDP growth, inflation, and the short-term interest rate, it is clear that the South African economy requires a real prime rate of below 5% to be able to grow at a meaningful rate. The current real prime rate is 7%, the highest level in several decades, which does not bode well for the country’s growth prospects.
Other key conclusions
-
The downward trend in the financial resilience of households would have been more pronounced in the absence of a welcome further increase in employment in both the private and public sectors, which represented one of the bright spots in the second quarter reading of the AFHRI. The upward trend in new job creation continued in the second quarter of 2023, with 154,000 new jobs having been created between April and June according to the Quarterly Labour Force Statistics by Statistics South Africa (Stats SA). Unfortunately, the momentum diminished during 2023, with 412,000 new jobs in the first half of the year, compared to more than a million in the first half of 2022.
-
The positive employment effect was not matched by total remuneration levels in the private sector, which weighed on the AFHRI given the declining year-on-year trend and high weighting amongst the composite indicators of the Index. Although the average monthly remuneration in South Africa was virtually unchanged over the past four quarters (at R15,863 in nominal terms), it declined by 5% in real terms (deflated by the consumer price index).
-
Amongst the negative indicators, the sharp increase in the ratio of debt costs to household income is a point of huge concern. On the average value of mortgage bonds administered by BetterBond, homeowners are now paying approximately R4,800 more per month than at the end of 2021.
-
Contrary to a recent media report, the value of surrenders of long-term insurance policies exhibits a declining trend. In the second quarter of 2023, this value was almost 6% lower year-on-year and almost 20% down on the figure at the beginning of 2019 (pre-COVID-19), in real terms.
-
The year-on-year increase in the value of short-term insurance premiums of more than 8% is an indication of a degree of resilience in the economy, as this indicator is positively correlated to the acquisition of assets, many of which are utilised as productive economic capital.
-
Credit impairments by banks have negatively influenced the AFHRI over all four of the periods under review, but this effect has diminished over the past year.

